The research that has been published for the amateur trader/investor who so desperately depends on such information is dividely optimistic. This means that the so called gurus of wallstreet who are responsible for these issued newsletters influence croud behavior with their own bullish bias, but add to the overly bullish sentiment that already exists. So when an individual is confronted with an investment decision, he must question whether that choice will limit his life or be more vulnerable to the conformity that is continually reinforced by the talking heads on wallstreet . A non conformist will ultimately think for himself, be it on an educational, physchological, or intellectual level. Those that have been conditioned to the standardizations of this market place lack the confidence and independence to think for themselves, thus are easily manipulated into making costly decisions, and in some cases, end up terminating their investing career. However, there is still hope for those who assert their individuality and chose to not confirm to the conventional wisdom. He will gradually understand that courage and self-determination does not amount to the ultimate reward which comes in the form of personal satisfaction.
I can honestly say, I am convinced this market is ready to roll over and die. Here are some charts to show you how close we are.
S&P Mini
SPX alternate scenario
The U.S. Dollar Index
A closer look at the Dollar

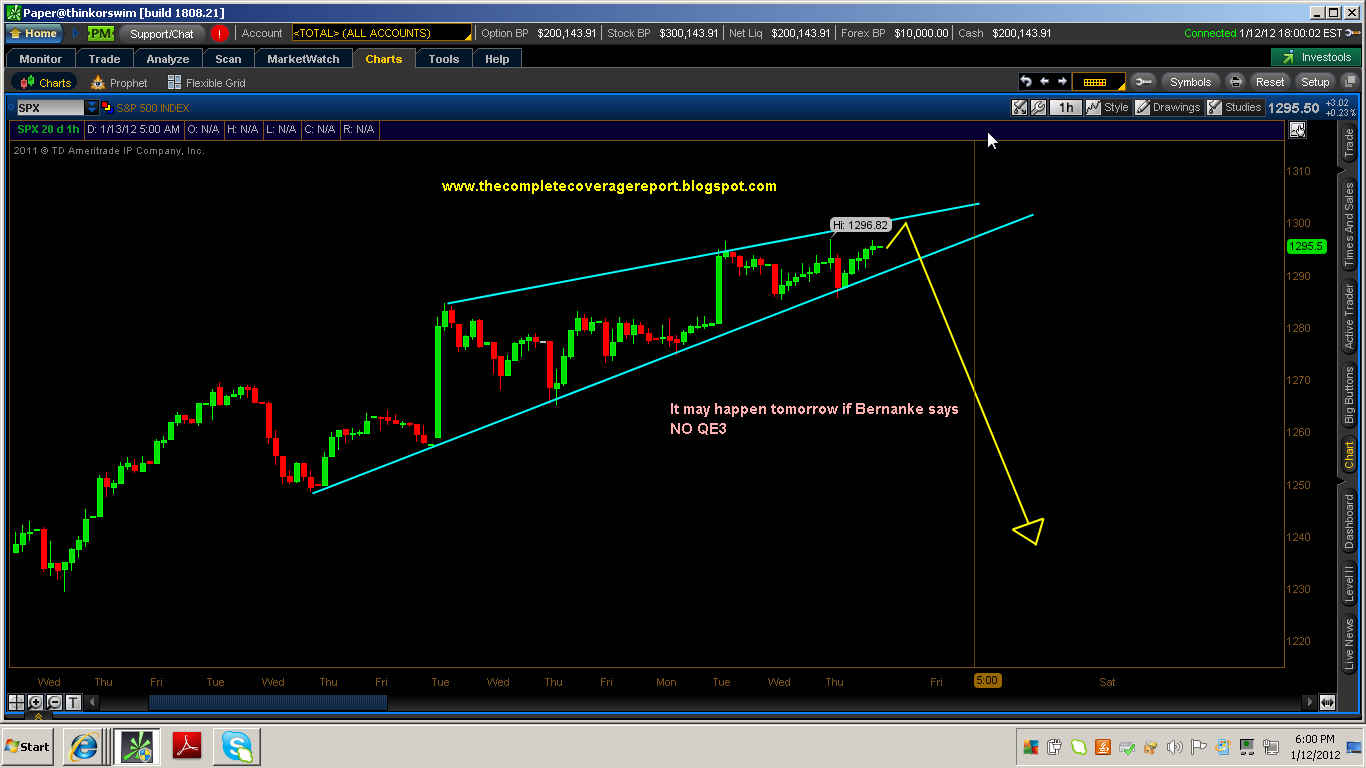


Rolling over to 1230 isn't exactly dying!
ReplyDeleteI appreciate your great daily analysis.
Thanks.
Hey Tom,
ReplyDeleteThe arrow pointing down is the direction for prices. I dont expect a halt at 1230, Im expecting the spx to reach 1000.
Thanks Darah.
ReplyDeleteI was being partly facetious, and I am also hoping for a waterfall decline to sub 1000. As a bear, though, my patience and interest in this market is waning on a daily basis.
By the way, one of the stocks on my list to short is CMG which shows negative divergence of mammoth proportions on every single level. What do you think of this one?
Chart of CMG here: http://img560.imageshack.us/img560/2540/cmg.png
ReplyDelete(Credit to Daneric at stockcharts.com)
Also looking at SBUX.
Darah, great work, any timeframe on when you might expect SPX to hit your target?
ReplyDeleteGiven that we are on day 34 of this current cycle- top this week at the latest. In terms of the next significant bottom- 5-7 trading weeks, which means a lot of selling to come
ReplyDeleteCompletely agree, let's see if today marks the top in the markets prior to a significant selloff.
Delete