The Dow Jones Transportation Average - Weekly Chart
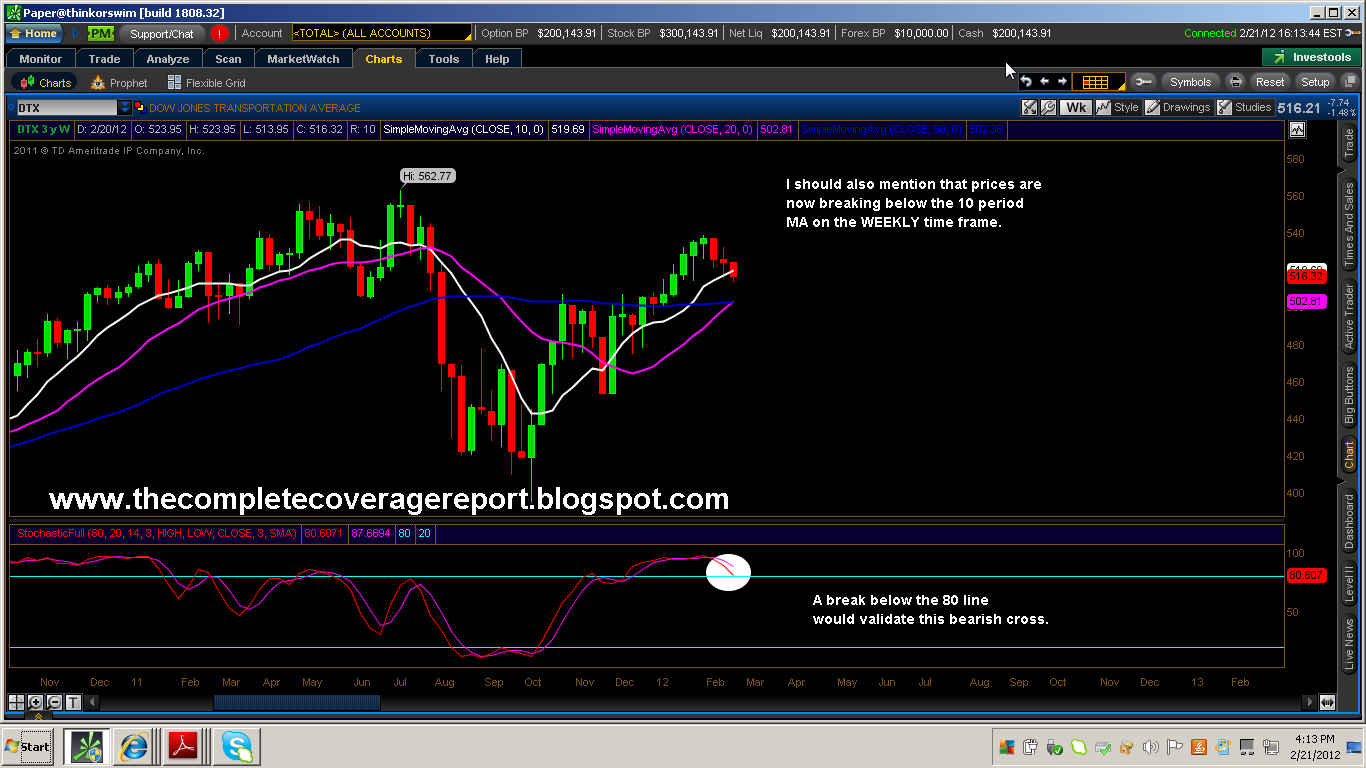
The Dow Transport Average is now revealing weakness in the weekly time frame. The selling pressure from today's session was enough for price to close below its 10 week MA. In addition, the bearish cross on the stochastic indicator reinforces this break down in price. Do keep in mind that the Transports usually lead the way for the rest of the market averages.
S&P 500 and Copper

When the two disagree in price, it is Copper that can usually predict the direction of the Market Averages. As you can see in the chart above, Copper has displayed a series of lower highs and lower lows, but the S&P 500 is revealing higher highs and higher lows. The divergence that has formed in their relationship is known as a "non-confirming" signal, suggesting that copper is not confirming the recent upside in the S&P 500.
The Russell Index- Daily Chart

Along with the Transports and Copper, the Russell too is not confirming the upside in the Dow or the S&P 500.
No comments:
Post a Comment