The Model

In my previous post, I explained how the slope of the 200 day moving average can properly identify a Bull or Bear Market. As you know, when the Red Line begins to slope downward, the Bear Market has begun. It is extremely important that you recognize this because your analysis is only half way complete.The other half requires that you identify the cause of this newly defined downward slope.
Prices that break below the 200 day MA will generally cause for the RSI to reach extremely oversold levels. The moving average will act as a magnet by following the direction of price. If prices sell-off enough to pull down a rising moving average, then the trend has changed direction.
2007-2009 Bear Market

In the chart above, I have illustrated the correlation between the S&P index and the RSI indicator. Now in order for you to fully understand their relationship, you must first recognize the discernably different characteristics of this indicator when in bull and bear markets. In a Bear Market, the RSI will serve the function of quantifying the degree of selling pressure. It is the extremity of these oversold conditions that accurately identifies each market bottom, unless a divergence has formed. Every bottom of the 2007- 2009 Bear market is colored with either a purple or blue circle. The purple circle corresponds with each time the RSI penetrates the 30 level. The Blue circle represents each time the RSI is contained above the 30 level. Here is another example.
The 2000-2003 Bear Market

This chart further reinforces the similarities that exist in Bear Markets.
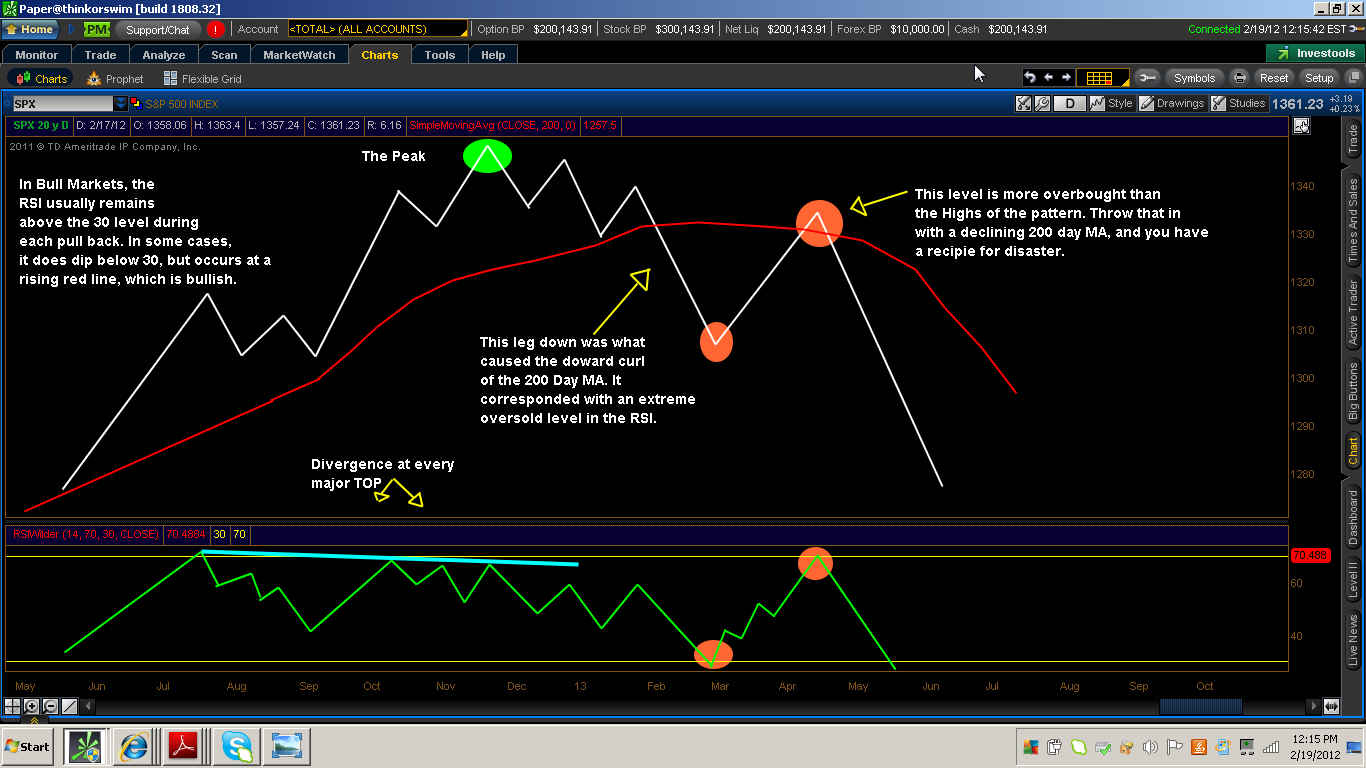
2003-2007 Bull Market

Notice that each pull back is contained above the 30 level on the RSI indicator when prices are in a bull market. There are some cases where that level is slightly penetrated, but prices are quickly regained at the rising 200 Day MA. The RSI in Bull markets do not reach the extreme oversold levels that you see in Bear Markes.
No comments:
Post a Comment